
 |
Research from cities worldwide ON THIS PAGE: Sports Cities Index 2015 || The top 20 cities |
|||||||||||||||||||||||||||||||||||||||||||||||||||||||||||||||||||||||||||||||||||||||||||||||||||||||||||||||||||||||||||||||
| FRONT PAGE About us CITIES RESEARCH • Research worldwide • Sports Cities Index 2015 • Research from the US • Mass shootings USA • Research from North America • Research from Latin America • Research from Europe • Research from Asia • Research from Africa |
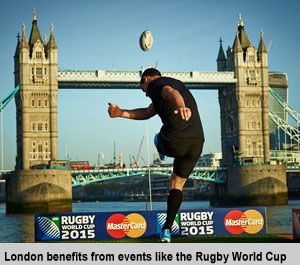 London wins gold London wins goldin index* that measures benefits of sporting events Review by Brian Baker 2 December 2015: London occupies first place in an index that measures a range of economic and social impacts of major international sporting events on host cities. In the second edition of the Global Sports Cities Index published in November 2015. Rio de Janeiro is in second place followed by Moscow in third. Tokyo and Paris complete the top five. Because the methodology takes account of the seven years before and after the event and weightings are applied reflecting the size and significance of events, recent and prospective Olympic hosts feature prominently. Unsurprisingly, Vancouver is the highest ranked North American city though it is only placed 15th overall. Auckland, in 13th position, is the second highest placed city from the southern hemisphere. The index for 2015 was based on 12 indicators but from 2016 the methodology is likely to comprise of 19 or 20 indicators. The existing indicators include those, which measure audiences, volunteering, participants, activity amongst the general public, media, sponsorship and more direct economic impacts. New for 2016 will be social media impact and more social and health benefit measures. The Global Sports Cities Index is produced by London-based SportCal, which produces sporting market intelligence and has built up an extensive database over years covering a range of products relating to international sporting events. The Index was first published in 2014. The 2015 Index includes 100 cities world-wide and is based on principles described in a 2014 Global Sports Impact Report produced by SportCal and previously developed for the Nations Index which the company began producing two years earlier. Chief Executive Mike Laflin told City Mayors, that “We began thinking about an index in 2011 because we thought that there was a heavy focus on the economic impact of major sporting events but little was done to attempt to measure the wider impacts.” Laflin says the most prominent missing factor is environmental measures, which SportCal have found to be inadequately measured by nations, host cities and sports federations. “Unfortunately, the data simply isn’t there,” he says. He says many sports bodies settle for analysis, which fails to reach out to all potential positive impacts. For instance Den Haag authority measured the impact on their city of hosting the 2014 Hockey World Cup. But, says Laflin, matches took place in other centres and the hockey federation could have tried to capture those benefits also. The 2015 Nations Index was also published in November. In 2015, this has Russia first with Canada second, the UK third and China fourth. The USA, Germany and France are next and Brazil is the highest ranked southern hemisphere nation in 8th position. The top six are the same as in 2014 reflecting the effect of a lengthy time-line approach to measuring impact as well as the successes in both bidding and delivery. The host cities and countries and sports federations approach to information and assessment is also significant. The methodology for the index scores cities and events over a 14 year span reflecting the practice of awarding an Olympic Games seven years in advance, e.g. Beijing was chosen to host 2022 in 2015. This decision influenced Beijing’s 9th position in the latest index as plans and expectations are a part as well as the event itself and subsequent analysis. The authors are trying to capture the overall impact on local society of the entire process. Full points are awarded in the event year and 90 per cent in the prior and succeeding years. Points reduce by 10 per cent for each year distant. The Index is at an evolutionary stage. Mike Laflin told City Mayors: “We would like to work towards a standard which would allow city staff to compare with others across different sporting events. This will help cities to better understand what they are likely to get for their money if they bid to host an event.” Currently, the weakest element is the paucity of sports events for athletes with disabilities. Only the Paralympics generate sufficient data. This might be something which future bidding and host cities could address. A population element will be added to the range of analysis in future. At present, Doha and Copenhagen are the best performing cities on per head of population measure. The Danish capital scores well for the nation’s sophisticated approach to bidding for international sports events for which function it has a dedicated unit. By scoring highly across several indices Copenhagen places 7th in the current index despite having only eight eligible events and a small population. The majority of events included are those, which hosts must bid for although the relevant criterion is that the event should move around. They must also usually embrace participants from more than one continent and must be held reasonably often, usually cyclically. Multi-sports events within a single continent like the Asian Games are, however, included. The Ryder Cup, restricted to golfers from two continents, is not. Although single-continent single-sport events are not eligible for the Index, Laflin says that the researchers intend that it will be possible for city officials to compare their performance on each group of indicators with others in their region e.g. those they choose to benchmark themselves against more generally. The world's top 20 sporting cities*
More detail can be found in the company’s Global Sports Impact Report. The next edition of the Cities Index will be produced in April 2016 and subsequently twice yearly. The Index, reports and analytical data are all available to Sport Cal subscribers. Details of this are available from sales@sportcal.com . Also visit the web-site on www.sportcal.com or phone 44 (0)208 944 8786 Follow @City_Mayors |